- Cisco Community
- Technology and Support
- Networking
- Network Management
- HUM - Polling the devices takes long time
- Subscribe to RSS Feed
- Mark Topic as New
- Mark Topic as Read
- Float this Topic for Current User
- Bookmark
- Subscribe
- Mute
- Printer Friendly Page
HUM - Polling the devices takes long time
- Mark as New
- Bookmark
- Subscribe
- Mute
- Subscribe to RSS Feed
- Permalink
- Report Inappropriate Content
08-29-2009 12:04 AM
Hello,
I have approx. 20 devices in the HUM. I have selected all the devices under Poller Management with 7 instances. It takes nearly half hour. How can this be improved. And how can I verify whether last poll was successful or not.
Is there a way to poll the devices in the background. Coz when I click next after making selection under Poller Management, it starts polling in the foreground.
Thanks
- Labels:
-
Network Management
- Mark as New
- Bookmark
- Subscribe
- Mute
- Subscribe to RSS Feed
- Permalink
- Report Inappropriate Content
08-29-2009 01:01 PM
I'm not sure I fully understand. All of the pollers run in the background automatically. The result of the last polling cycle is visible under HUM > Poller and Template Management > Poller Management (if there were any errors, they will be visible in the Status column).
Can you point out exactly where you're seeing the 30 minute delay? A screenshot would be helpful.
- Mark as New
- Bookmark
- Subscribe
- Mute
- Subscribe to RSS Feed
- Permalink
- Report Inappropriate Content
08-29-2009 01:53 PM
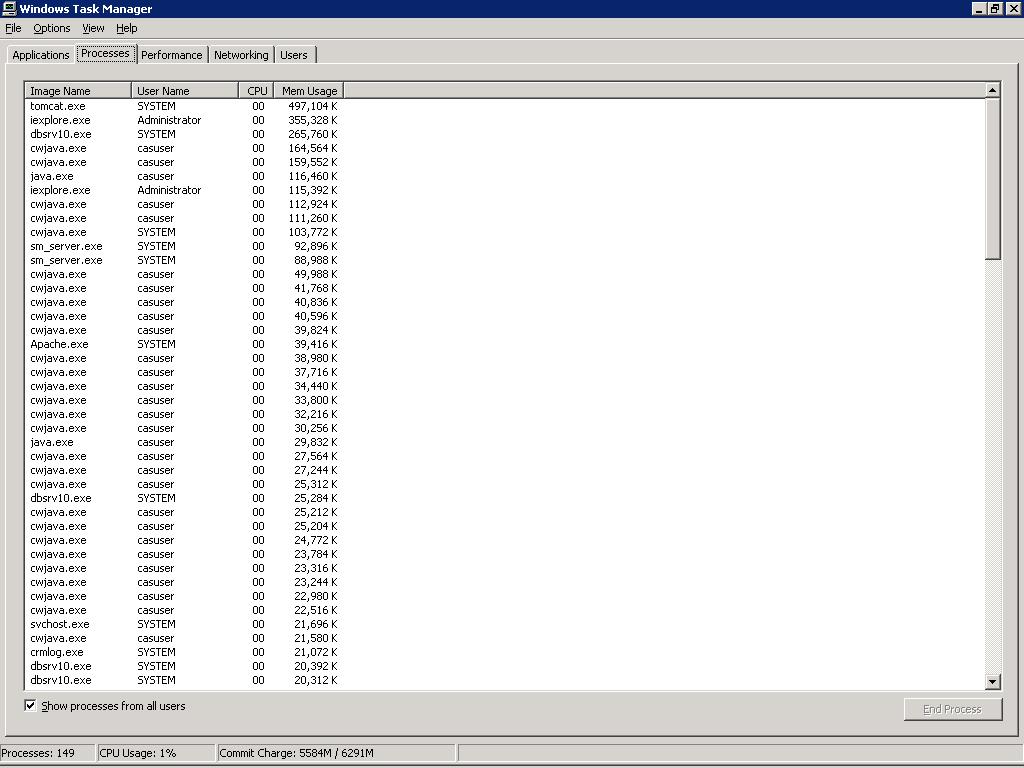
I have attached the screenshot.
If I go to Poller -> Poller management -> Select an already defined Poller (with 20+ devices and 7 templates) -> Edit -> Click Next or Finish, it starts polling and shows the attached screen.
Secondly, is the previous run successful if there are no errors in the Status column. Should all errors be looked into such as instance not available etc.
- Mark as New
- Bookmark
- Subscribe
- Mute
- Subscribe to RSS Feed
- Permalink
- Report Inappropriate Content
08-29-2009 02:01 PM
What templates did you select? What type of devices are in this poller? How heavily loaded is the server? HUM will attempt to walk the various tables (as defined by the templates) to obtain the selected (or all) instances. If the devices are slow to respond to SNMP queries for the tables in question, or the server is heavily loaded, this can take a long time.
Yes, if no errors are seen, then all instances were successfully polled for the previous polling cycle. No such instance errors can point to an SNMP problem on the device, but it could also be that high-capacity counters weren't available for a specific interface, so HUM fell back to low-capacity counters. This is only true for interface utilization.
- Mark as New
- Bookmark
- Subscribe
- Mute
- Subscribe to RSS Feed
- Permalink
- Report Inappropriate Content
08-29-2009 05:19 PM
I have selected CPU, Memory, Interface Utilization, Temperature, Device Availability, Interface Availability, Interface Error templates.
There are 27 devices including ASA, ACE Modules, Cat65K, 2800 Routers, GSS, FWSM.
The server performance seems to be the cause. CPU is constantly 1% but the 'PF Usage' is 5.44 GB. The physical memory on the server is 4GB out of which 500MB is available while the process is running. How can I reduce the PF Usage.
- Mark as New
- Bookmark
- Subscribe
- Mute
- Subscribe to RSS Feed
- Permalink
- Report Inappropriate Content
08-29-2009 05:23 PM
- Mark as New
- Bookmark
- Subscribe
- Mute
- Subscribe to RSS Feed
- Permalink
- Report Inappropriate Content
08-29-2009 08:01 PM
PF usage is probably not the issue. The issue most likely stems from time take to poll the devices. If you start a sniffer trace filtering on SNMP traffic to all of the devices in the poller, then trigger the problem, the resulting capture file should shed some light on the delay.
- Mark as New
- Bookmark
- Subscribe
- Mute
- Subscribe to RSS Feed
- Permalink
- Report Inappropriate Content
08-29-2009 10:30 PM
Ok.
In the ASA logs, I see the following in big number
ASA-3-212005: incoming SNMP request (563 bytes) from IP address HUMIP Port 1745 Internet "management" exceeds data buffer size, discarding this SNMP request.
What does this mean ?
- Mark as New
- Bookmark
- Subscribe
- Mute
- Subscribe to RSS Feed
- Permalink
- Report Inappropriate Content
08-29-2009 10:33 PM
The SNMP request is too large for the device to process. This has to do with the number of templates in your poller. Try breaking the templates out into separate pollers (e.g. one poller to handle memory, CPU, and environment, one to handle interface utilization, one to handler errors, and one for availability).
- Mark as New
- Bookmark
- Subscribe
- Mute
- Subscribe to RSS Feed
- Permalink
- Report Inappropriate Content
08-29-2009 10:45 PM
I just added a single ASA device with CPU Utilization only.
The response came soon with
"No instances are found in the devices. This could be because the device is unreachable, or the device does not have the instances for the selected templates or the time out value is low."
Is the default CPU utilization template supported by ASA.
Thanks.
- Mark as New
- Bookmark
- Subscribe
- Mute
- Subscribe to RSS Feed
- Permalink
- Report Inappropriate Content
08-29-2009 10:57 PM
No, it might not. The object used is cpmCPUTotal5minRev which is a new object in the CISCO-PROCESS-MIB (and not support in most versions of ASA code). The old, deprecated object, cpmCPUTotal5min IS supported by all versions of ASA code. You will need to create a new template for this older object, and apply that to your ASA devices.
- Mark as New
- Bookmark
- Subscribe
- Mute
- Subscribe to RSS Feed
- Permalink
- Report Inappropriate Content
08-29-2009 11:02 PM
Is the same applicable to FWSM. I am running version 3.2(2).
- Mark as New
- Bookmark
- Subscribe
- Mute
- Subscribe to RSS Feed
- Permalink
- Report Inappropriate Content
08-29-2009 11:12 PM
I tried cpmCPUTotal5min only with ASA device and it still gives the same response. The ASA code is 8.0(4).
- Mark as New
- Bookmark
- Subscribe
- Mute
- Subscribe to RSS Feed
- Permalink
- Report Inappropriate Content
08-30-2009 01:45 AM
When I do snmpwalk with the ASA device on (.1.3.6.1.4.1.9.9.109.1.1.1) it returns
CISCO-PROCESS-MIB::cpmCPUTotalPhysicalIndex.1 = INTEGER: 1
CISCO-PROCESS-MIB::cpmCPUTotal5sec.1 = Guage32: 5
CISCO-PROCESS-MIB::cpmCPUTotal1min.1 = Guage32: 5
CISCO-PROCESS-MIB::cpmCPUTotal5min.1 = Guage32: 4
Yet when I create the template with same MIB object, it fails with the poller saying 'No instance available'.
How could this be ?
- Mark as New
- Bookmark
- Subscribe
- Mute
- Subscribe to RSS Feed
- Permalink
- Report Inappropriate Content
08-30-2009 09:54 AM
This is a bug in HUM. HUM is expecting the value of cpmCPUTotalPhysicalIndex to be 0. When it's not, HUM ignores the instance. Unfortunately, there is no workaround at this time.
Find answers to your questions by entering keywords or phrases in the Search bar above. New here? Use these resources to familiarize yourself with the community: