- Cisco Community
- Technology and Support
- Wireless - Mobility
- Wireless
- Radio Signal Diagram - CAP1602I
- Subscribe to RSS Feed
- Mark Topic as New
- Mark Topic as Read
- Float this Topic for Current User
- Bookmark
- Subscribe
- Mute
- Printer Friendly Page
Radio Signal Diagram - CAP1602I
- Mark as New
- Bookmark
- Subscribe
- Mute
- Subscribe to RSS Feed
- Permalink
- Report Inappropriate Content
08-25-2013 06:11 AM - edited 07-04-2021 12:42 AM
Hellooo,
i will be having the:
WLC: AIR-CT2504-50-K9 and having another WLC for HA
and
AP: CAP1602I
what i am concern of is the signal diagram, or the broadcast diagram for this access point?
how the AP signal will be Distributed around here,will it be a circle or in which shape ?
- Labels:
-
Wireless LAN Controller


- Mark as New
- Bookmark
- Subscribe
- Mute
- Subscribe to RSS Feed
- Permalink
- Report Inappropriate Content
08-25-2013 06:39 AM
Signal varies depending on attenuation from objects in its path. There is no real shape you can compare the signal coverage to. A site survey using a tool can capture signals and show you the signal coverage pattern.
In an open field with nothing around, the signal will propagate in a circle. Once you start putting object in, them that theory goes away.
Sent from Cisco Technical Support iPhone App
*** Please rate helpful posts ***
- Mark as New
- Bookmark
- Subscribe
- Mute
- Subscribe to RSS Feed
- Permalink
- Report Inappropriate Content
08-25-2013 06:45 AM
what i want is will the signal shape be like ths or what is the real broadcast shape:
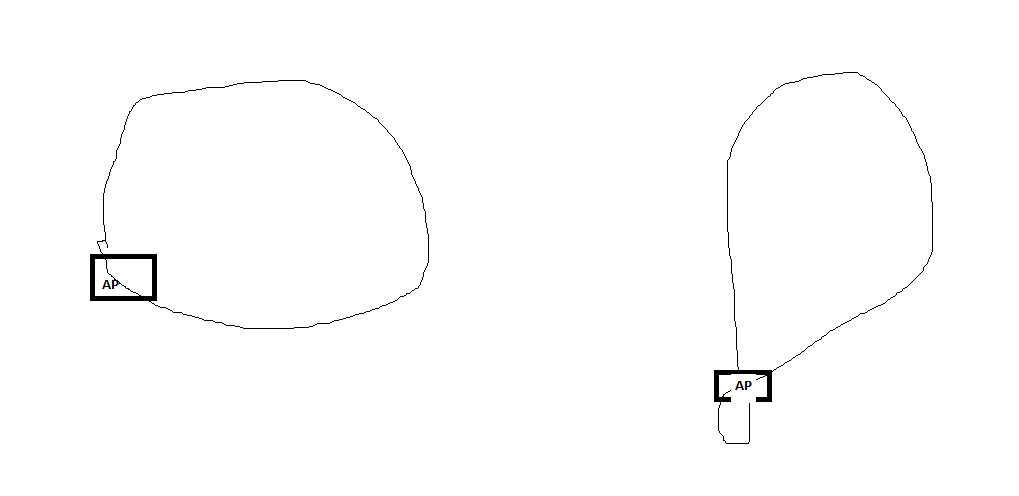
i hope i deliviring the info correctly.
- Mark as New
- Bookmark
- Subscribe
- Mute
- Subscribe to RSS Feed
- Permalink
- Report Inappropriate Content
08-25-2013 08:36 AM
The AP is an omni, so the signal will propagate in a circle.
Sent from Cisco Technical Support iPhone App
*** Please rate helpful posts ***
- Mark as New
- Bookmark
- Subscribe
- Mute
- Subscribe to RSS Feed
- Permalink
- Report Inappropriate Content
08-25-2013 11:12 AM
Thank you,
but what is the recommended distance from the client and the AP
and the recommended distance from an AP and the other AP
- Mark as New
- Bookmark
- Subscribe
- Mute
- Subscribe to RSS Feed
- Permalink
- Report Inappropriate Content
08-25-2013 11:17 AM
Client to ap depends on what applicant .. Data = 75 dBm voice = 67 dBm (edge) also keep in mind this is assuming an accurate link budget
Ap to ap in same channel you need a minimum of 20 dBm
Sent from Cisco Technical Support iPad App
___________________________________________________________
- Mark as New
- Bookmark
- Subscribe
- Mute
- Subscribe to RSS Feed
- Permalink
- Report Inappropriate Content
08-25-2013 11:20 AM
can we convert the dBm values to distance in meters
- Mark as New
- Bookmark
- Subscribe
- Mute
- Subscribe to RSS Feed
- Permalink
- Report Inappropriate Content
08-25-2013 11:30 AM
If you whisper something and I say I heard it at -90 dBm and then you yell at me and I say I heard you at -50 dBm .. All depends on how loud your ap is tx, antenna gain, and antinuation
Sent from Cisco Technical Support iPad App
___________________________________________________________
- Mark as New
- Bookmark
- Subscribe
- Mute
- Subscribe to RSS Feed
- Permalink
- Report Inappropriate Content
08-26-2013 12:55 PM
You can... sort of.
Your RSSI is a measure of how much "volume" is lost, as in George's example. This gives you the basis of how to lab this out and get your own readings.
Lab this out in a relatively open area, eg auditorium, lobby, etc... or better yet on site. Set up the AP, take your most representative client device and--if the client device doesn't show signal strength in RSSI--a smartphone with a wifi app that shows RSSI (there are abundant examples).
Step one meter away, refresh smartphone RSSI readout, run standard operations representative of daily operations with the client device. Document your findings as to distance, RSSI, and acceptability of client device operations.
Repeat until you find where your client device is unacceptable. This should give you a baseline understanding of ROUGHLY what to expect. You will have different interference patterns from client devices, APs, microwaves, physical obstructions, etc etc etc. Use these as your numbers, and ensure anyone who sees your distance chart understands it is NOT 100% accurate in all situations, just a rough guess to help you decide how far is too far from the AP.
Technically it will NOT tell you how far is close enough to the AP! This is due to all the possible interferences and variances... but it can help you plan a whole lot better.
- Mark as New
- Bookmark
- Subscribe
- Mute
- Subscribe to RSS Feed
- Permalink
- Report Inappropriate Content
08-26-2013 08:10 PM
There are planners you can use to guess on coverage. Always best to do an active survey ..
Sent from Cisco Technical Support iPad App
___________________________________________________________
Find answers to your questions by entering keywords or phrases in the Search bar above. New here? Use these resources to familiarize yourself with the community:
