- Cisco Community
- Technology and Support
- Networking
- Routing
- something about high cpu process _
- Subscribe to RSS Feed
- Mark Topic as New
- Mark Topic as Read
- Float this Topic for Current User
- Bookmark
- Subscribe
- Mute
- Printer Friendly Page
something about high cpu process _
- Mark as New
- Bookmark
- Subscribe
- Mute
- Subscribe to RSS Feed
- Permalink
- Report Inappropriate Content
06-11-2009 06:06 PM - edited 03-04-2019 05:05 AM
CPU utilization for five seconds: 78%/2%; one minute: 77%; five minutes: 78%
PID Runtime(ms) Invoked uSecs 5Sec 1Min 5Min TTY Process
47 3280182123005882357 109 51.19% 51.08% 51.29% 0 Cat4k Mgmt LoPri
what's the reason for the high cpu process?
- Labels:
-
Other Routing
- Mark as New
- Bookmark
- Subscribe
- Mute
- Subscribe to RSS Feed
- Permalink
- Report Inappropriate Content
06-11-2009 07:26 PM
Issue a "sh proc cpu" and see what process or processes stand out. If unsure post output here.
- Mark as New
- Bookmark
- Subscribe
- Mute
- Subscribe to RSS Feed
- Permalink
- Report Inappropriate Content
06-11-2009 10:00 PM
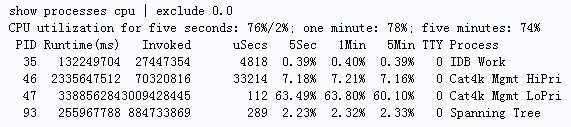
or "show proc cpu | exc 0.0" to get a better view.
- Mark as New
- Bookmark
- Subscribe
- Mute
- Subscribe to RSS Feed
- Permalink
- Report Inappropriate Content
06-11-2009 11:22 PM
- Mark as New
- Bookmark
- Subscribe
- Mute
- Subscribe to RSS Feed
- Permalink
- Report Inappropriate Content
06-11-2009 11:45 PM
Have you made any recent changes to ur network that might have caused this ?
there are also few bugs related to using 801.1x, but to safe lets be methodical and start troubelshooting from basics. see attached link.
http://www.cisco.com/en/US/products/hw/switches/ps663/products_tech_note09186a00804cef15.shtml
HTH
Sam
- Mark as New
- Bookmark
- Subscribe
- Mute
- Subscribe to RSS Feed
- Permalink
- Report Inappropriate Content
06-12-2009 12:29 AM
Discover and save your favorite ideas. Come back to expert answers, step-by-step guides, recent topics, and more.
New here? Get started with these tips. How to use Community New member guide
